Weekly Lab Report – November 19, 2025
Thoughts on the shutdown, the “K-shaped economy,” and price measures
Fiscal Lab Notes is the official Substack page for the Fiscal Lab on Capitol Hill. You can check out all our work and analyses at fiscallab.org.
The federal government reopened last week, but Americans will still be feeling the effects of the shutdown for some time.
An Increasingly Bifurcated Economy
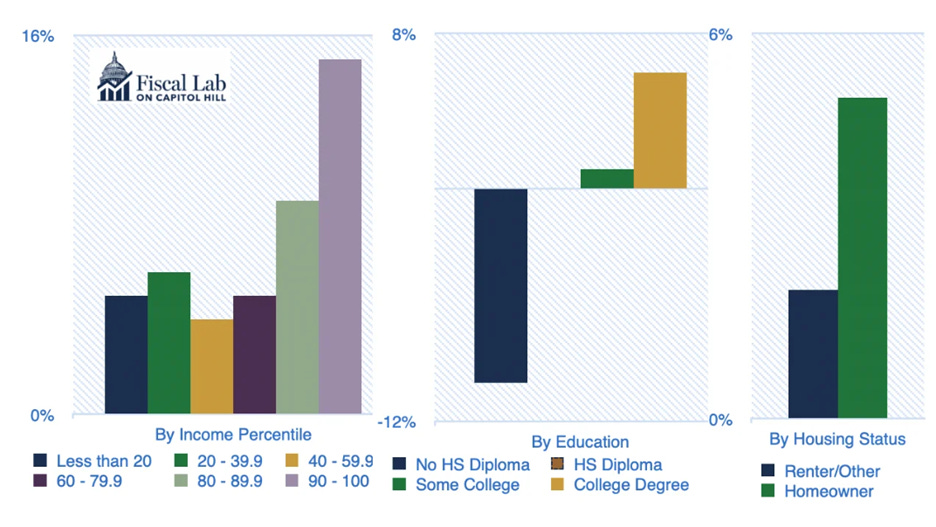
Before turning to the shutdown in more detail, the Fiscal Lab’s Joseph McCormack has a new primer on America’s “K-shaped economy” where wealthier individuals are seeing their incomes rise faster than those with lower incomes who are struggling to keep up. As shown in Figure 1, Americans with higher levels of education and who are homeowners are seeing their incomes rise more than those with less education and those who rent.
Figure 1. Median real income growth rates from 2019 to 2022
Citation: Survey of Consumer Finances | Federal Reserve Board of Governors
Costs of the Shutdown and Fiscal Multipliers
There is no doubt that government shutdowns come with an economic cost. According to the Bipartisan Policy Center, “at least 670,000 workers” were furloughed. Those workers will be retroactively paid for being forced to sit on their hands for 43 days rather than for fulfilling their responsibilities. Uncertainty over SNAP benefits put food banks on “high alert.” Other spillovers from the shutdown include a decline in tourism, with the closing of museums and natural parks, and in dining at restaurants.
Just how big will the full effects of the shutdown be? On October 25, in a response to a request from Representative Jodey Arrington, Congressional Budget Office (CBO) Director Phillip Swagel provided a set of estimates based on whether the shutdown lasted four, six, or eight weeks. Swagel mentions that the CBO uses “a cumulative demand multiplier of 1.2.” In other words, for every $1 not spent toward normal government activity, economic activity, like real GDP, drops $1.20.
CBO’s demand multiplier cited in the letter is closely related to the idea of the “fiscal multiplier,” which posits that a change in government spending or taxes is associated with a corresponding change in economic activity. For example, if the fiscal multiplier is greater than 1, economic activity rises more than one-for-one with every additional $1 spent. If it’s less than 1, economic activity rises less than one-for-one with every additional $1 spent. If it’s zero, then economic activity doesn’t rise, and if it’s less than zero, economic activity contracts.
The size of the fiscal multiplier changes over time and depends on several factors including whether the spending is temporary or permanent and what stage of the business cycle the economy is in, therefore making it very difficult to estimate. However, many economists argue that the multiplier is typically below one. For example, economist Valerie Ramey, who has written prolifically on this topic, has observed “most estimates of government spending multipliers . . . are in the range of 0.6 to 0.8, or perhaps up to 1.” Alternatively, economist Scott Sumner has argued that the multiplier is approximately zero because any change in output from a change in government spending should be offset by a change in monetary policy.
With most estimates of the fiscal multiplier below one, CBO’s 1.2 multiplier seems high. In fairness to CBO, it is looking at an abrupt shutdown where federal government activity slows as opposed to a more traditional change in fiscal policy where Congress purposely changes its appropriations to various programs. Nevertheless, readers of the CBO letter should not jump to the conclusion that government spending generally leads to greater than one-for-one changes in total economic activity.
CPI and PPI
Another cost of the shutdown will be the delay and even cancellation of the publication of government data. On that note, Bill Beach has a new explainer (published by our friends at EPIC) on the Consumer Price Index (CPI), which measures the prices consumers face, and the Producer Price Index (PPI), which measures the prices domestic producers receive. The PPI can be broken down into prices for “final demand products” that consumers buy and the prices for “intermediate demand products,” which are used by other producers to ultimately make goods for consumers.
The CPI is the most well-known price index. The original CPI was designed to reflect what blue-collar families purchased. This series still exists and is now called CPI-W (“w” for wage earners), but it is no longer the official CPI, which is now the CPI-U and tracks the purchases of a typical urban household (hence, “u” for urban). The Bureau of Labor Statistics (BLS) made this switch in 1978 to account for the economy’s shift toward more white-collar jobs relative to blue-collar ones.
Despite the BLS’ sound reasoning for switching from CPI-W to CPI-U, annual Social Security cost-of-living adjustments are based on the CPI-W. Since the CPI-W tends to rise at a faster rate than the CPI-U, Social Security benefits grow at a faster rate than overall inflation. This is an important point as the future of Social Security looks increasingly grim.
Going Forward
Readers may be interested to know that the Fiscal Lab held its very first annual board meeting last week. Board members, Veronique de Rugy and David Malpass, were very enthusiastic about our plans for quantifying good ideas that move us back from fiscal crisis and benefit not only the American economy, but also its national security.
While we will be continuing to score proposals and put out primers over the coming weeks, we are also taking a break from this newsletter next week. The Fiscal Lab wishes you and your loved ones a happy Thanksgiving!


