
Some FLARE for the Fourth and a History of US Budgeting
Weekly Lab Report – July 3, 2026

Fiscal Lab Notes is the official Substack page for the Fiscal Lab on Capitol Hill. You can check out all our work and analyses at fiscallab.org.
Are the Working Families Tax Cuts Working?
July 4th is the 250th anniversary of the United States, but it’s also the one-year anniversary of the Working Families Tax Cuts Act (also called the One Big Beautiful Bill Act). In a new Fiscal Lab update, Matt Dickerson argues that this law has combined household tax relief with pro-growth tax policy.
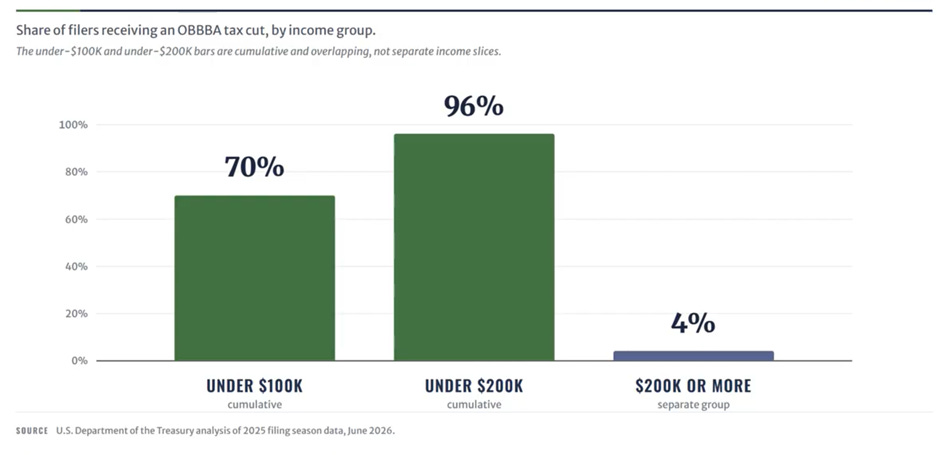
He points out that the IRS has issued $50 billion more in refunds than it did at this time last year. The average refund for 2026 is $3,276, up $337 from last year’s $2,939. Moreover, as seen in Figure 1, this relief is broad based, as a whopping 96 percent of taxpayers who received a tax cut earned less than $200,000.
Figure 1. Most tax filers under $200,000 receive a tax cut
Dickerson also stresses the law’s restoration of immediate expensing for capital investment and research and development and allowed expensing for new manufacturing structures. These policies reduce the cost of building, hiring, and producing in the United States and improve economic growth.
A Whirlwind Tour of US Budget History
To celebrate America 250, Doug Branch gives an overview of the history of the US budget.
Modern federal budgeting begins with the 1974 Budget Act, which created the House and Senate Budget Committees as well as the Congressional Budget Office (CBO). Unfortunately, the 1974 law has failed to reduce annual deficits.
Branch turns to pre-1974 history to see if there are any lessons to be learned. Prior to 1921, the budget process included a mix of features including dispersed appropriations, the president sometimes spending money ahead of Congress, and project-specific bonds for major expenses like the Mexican-American War and Panama Canal. The Budget and Accounting Act of 1921 called for a single, consolidated budget and created the Office of Management and Budget (OMB) and the Government Accountability Office (GAO). Following the 1921 law, a shift occurred with executive branch personnel determining increasing levels of funding then approved by Congress.
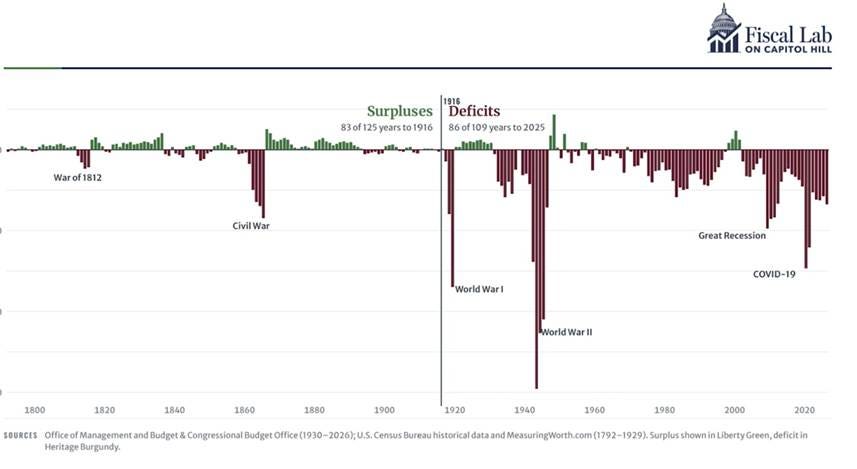
As shown in Figure 2, Branch observes that the United States saw surpluses in 83 of its first 125 years, but it has seen deficits in 86 of the last 109 years. With the 1974 Budget Act failing to achieve fiscal balance, Branch argues budget reform is “ripe for consideration” as we look back on the last 250 years.
Figure 2. Federal budget balance percent of GDP, 1792–2026
A New Budget and Economic Model
The CBO’s baseline is a projection, built on certain assumptions set by law, of budgetary and economic outcomes. This baseline, which is the benchmark used to score legislation, relies on single point estimates, and it often does not report the uncertainty surrounding those estimates.
Last week, the Fiscal Lab unveiled a preview of the Fiscal Lab Aggregate Revenue and Expenditure model (FLARE). Developed by Parker Sheppard, FLARE is a budget and economic forecast model that includes a range of estimates, rather than just one point estimate, and is designed to complement CBO’s regular baseline.
The budget side of FLARE calculates aggregate revenues and expenditures for the federal government, while the economic side can be run with revenues and expenditures as inputs to forecast the economic variables. The macroeconomic effects on these economic variables then feed back into the budget estimates.
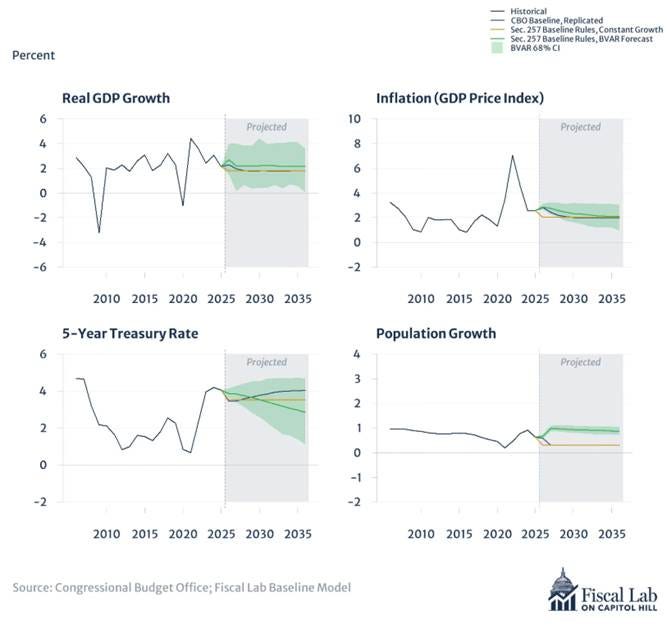
FLARE is designed to be simple, transparent, and easy to update. The model contains only six variables: real GDP growth, inflation, average interest on federal debt, population growth, aggregate revenue, and aggregate outlays. It also produces outcomes similar to the CBO’s baseline projection of real GDP, inflation, and the interest on federal debt as shown in Figure 3, where CBO’s baseline (blue) and FLARE’s forecasts under different rules (yellow and green) tend to be very close in the near term, though the interest rate projections diverge more in the outer years. This simplicity is a major strength of FLARE as it can produce quality forecasts with less information than CBO uses.
Figure 3. Economic outlook comparison
FLARE is still being developed. We are working to add greater detail to see projections of specific forms of revenue and outlays rather than aggregates. We are also working to expand its ability to capture economic volatility.
When FLARE is fully ready in the coming months, users will be able to interact with the model by specifying policy paths for the variables included in the model or by constructing simple rules for spending (e.g., a “current policy” rule where Congress keeps current tax rates and spending levels, adjusted for inflation, in place).
Happy Independence Day!