

Fiscal Lab Notes is the official Substack page for the Fiscal Lab on Capitol Hill. You can check out all our work and analyses at fiscallab.org.
Firms and individuals alike are bringing large language models (LLMs) into their daily routines, but research into how AI affects the economy exposes a problem: The US statistical system doesn’t hold the data necessary to track AI’s impact. AI systems operate at the task level, changing just parts of a job’s responsibilities rather than the whole picture, but federal statistics mostly operate at the job level. In a new Fiscal Lab policy brief, based on work with Dr. William Beach and Michael Schultz, I argue that federal agencies should build a task-classification taxonomy that connects to existing classification systems, giving each task its own requirements and economic weight.
Nearly every question researchers ask about AI is a question of magnitude: How much are certain job sectors exposed? How much will firms stand to gain or lose? The current statistical system often labels task data rather than measures qualitative points, so it’s unequipped by design to answer those questions. Because of this, most industry-leading exposure studies often rely on privately collected data and internal sources.
Private data, however, often restricts opportunities to researchers already “in” with private sources. Private data also means proprietary data collection, making statistical accuracy harder to verify in a source. A federal system would allow for the democratization of economic data related to AI’s exposure and ensure a publicly reviewed collection process that supports the research.
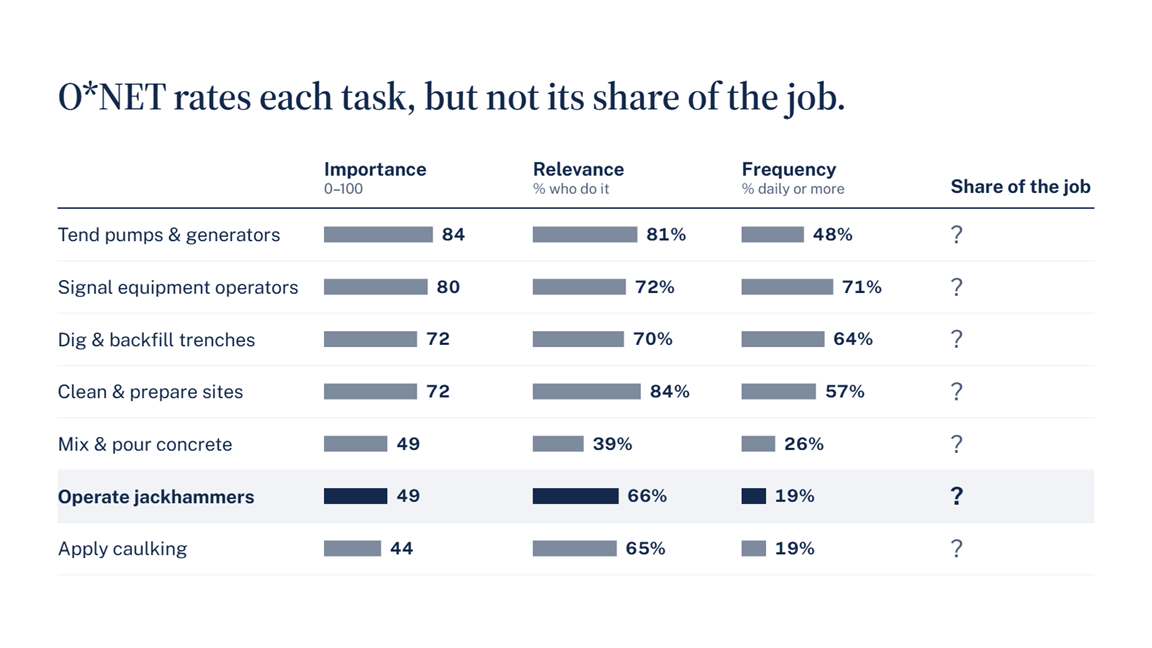
Figure 1. O*NET rates each construction-laborer task, but not its share of the job
To illustrate the problem, the policy brief examines the listing for construction laborers in the leading task-level data source, the Occupational Information Network (O*NET). As illustrated in Figure 1, O*NET rates a task on importance, the share of workers who do it, and its frequency (not duration). Yet, there is a glaring omission: O*NET doesn’t track the shares of time or output that each individual task contributes to the job’s total. From this, any exposure found for a particular task cannot easily be traced to a finding about how time or output changes for jobs as a whole.
Most existing AI exposure research relies on various methods to work across this gap. For example, some approaches use human/LLM raters to estimate the task share of time and output, and others attempt to crosswalk O*NET with complementary datasets. However, the introduction of rating and/or differently sampled data increases the chance of statistical errors, as well as generally complicating the methods.
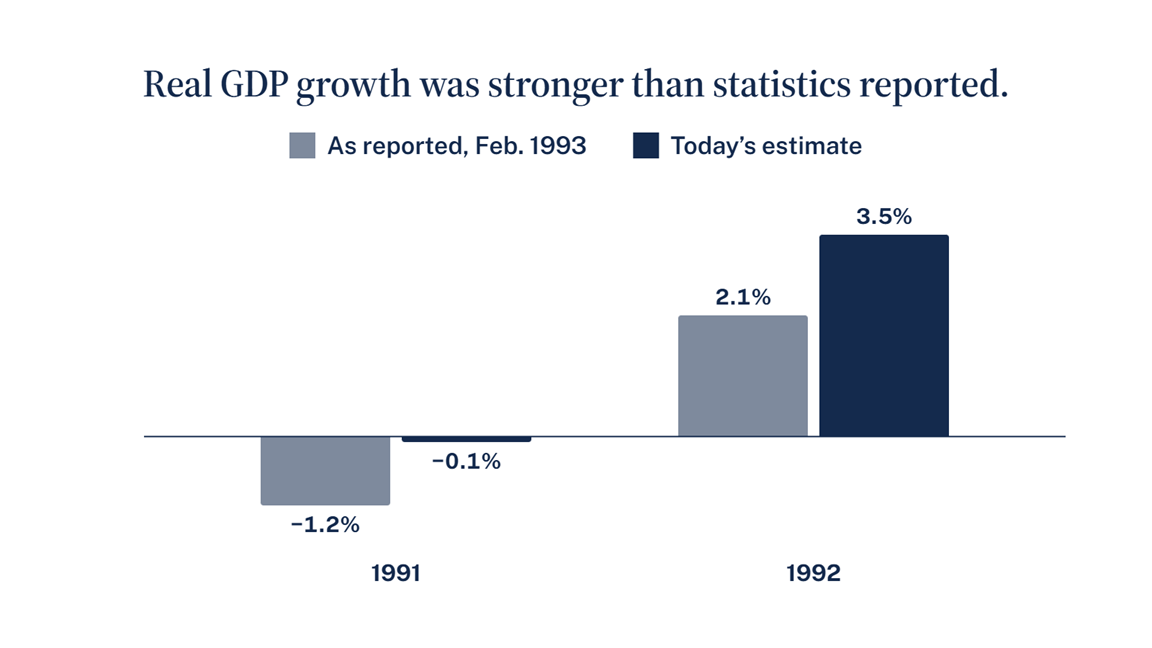
Figure 2. Real GDP growth in 1991 and 1992 was stronger than first reported
The current situation reminds us of the early 1990s, when the gains from desktop computing had not yet shown up in productivity statistics (the so-called Solow paradox). As seen in Figure 2, real GDP growth was originally reported far lower than what it was later revised to. A reported contraction of 1.2 percent in 1992 was later estimated to be 0.1 percent, and previously reported growth of 2.1 percent was later revised to 3.5 percent. The revisions revealed that the rate of technology adoption largely masked a chunk of growth.
Like then, the US economy may now be growing faster than measured because we lack the data required to track the change. Especially considering the acceleration of technological growth and the immense amounts of capital invested in tech ventures, data centers, and other AI-critical infrastructure, it is crucial that policymakers and businesses are well equipped to respond to how the economy really is. A task-based system would allow statistical agencies to trace changes caused by AI upward through occupations and industries, allowing faster response estimation and more accurate economic research.
Read the full brief, “Closing the Task Data Gap in Federal Statistics,” at fiscallab.org.
Figure sources
Fig. 1. US Department of Labor, Employment and Training Administration, “47-2061.00 - Construction Laborers,” O*NET OnLine, updated 2026, accessed October 19, 2026. Task statements and Importance scores as displayed; Core/Supplemental designation per O*NET. On the Relevance and Frequency scales, see National Center for O*NET Development, “Task Ratings,” O*NET Data Dictionary, and “Scales, Ratings, and Standardized Scores,” O*NET OnLine Help.
Fig. 2. As first reported: Joint Economic Committee, Economic Indicators, February 1993 (prepared by the Council of Economic Advisers; data available as of March 3, 1993), “Gross Domestic Product in 1987 Dollars,” annual levels for 1990–92, FRASER, Federal Reserve Bank of St. Louis, growth rates computed from the published levels. Today’s estimate: US Bureau of Economic Analysis, “Real Gross Domestic Product (GDPC1),” retrieved from FRED, Federal Reserve Bank of St. Louis, accessed October 19, 2026, annual averages of quarterly data. On the 1993 revision, see US Department of Commerce, Bureau of Economic Analysis, “Annual Revision of the U.S. National Income and Product Accounts,” Survey of Current Business 73, no. 8 (August 1993): 9–51.
